Try it now
Interactive web terminal
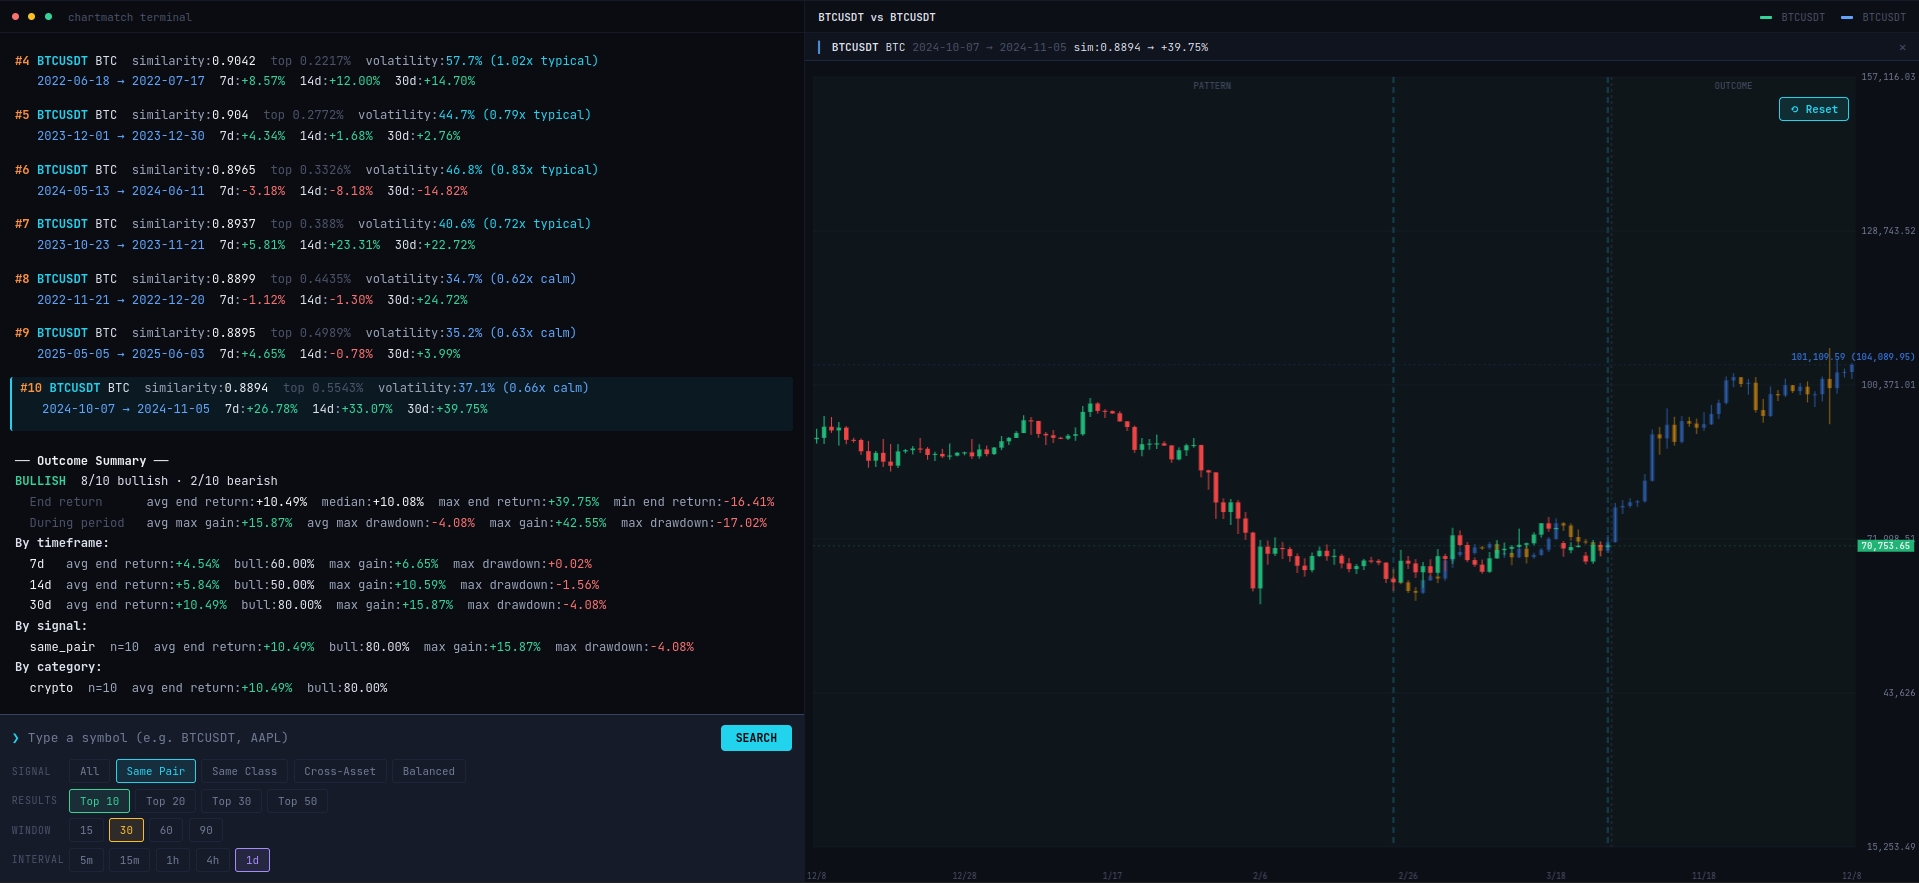
Search any instrument, see pattern matches with full charts, and explore outcomes right in your browser. No API key needed to try.
ChartMatch scans millions of historical candles across crypto, stocks, forex, commodities, and indices to find the closest pattern matches then shows you exactly what happened next.
One API call. Structured results. No data pipeline to maintain.
BTCUSDT, AAPL, Gold, EUR/USD any of 500+ instruments across crypto, stocks, forex, commodities, indices, and ETFs.
Dynamic Time Warping compares your chart's recent shape against millions of historical candle windows to find the closest matches.
Each match shows 7-day, 14-day, and 30-day outcomes with confidence scores, volatility context, and consensus direction across all matches.
Every result tells you what happened next, how confident the match is, and what the consensus says.
curl -X POST /v1/similar-patterns \
  -H "X-API-Key: cm_your_key" \
  -H "Content-Type: application/json" \
  -d '{"symbol":"BTCUSDT","lookback":30,"top_n":10}'
{
  "symbol": "BTCUSDT",
  "relevance": "same_pair",
  "similarity": 0.9487,
  "confidence": "top 0.003%",
  "volatility_ratio": 1.12,
  "volatility_context": "normal",
  "period": "2024-03-12 → 2024-04-10",
  "outcome": {
    "return": "+15.21%",
    "max_gain": "+18.40%",
    "max_drawdown": "-3.12%",
    "direction": "bullish"
  },
  "outcome_summary": {
    "consensus": "7 of 10 bullish (70%)",
    "avg_return": "+8.73%"
  }
}
When your BTC chart matches Gold from 2019 and the S&P 500 from 2022, that's an insight you can't find by looking at one asset in isolation.
All instruments synced daily from Binance and Yahoo Finance. 13+ years of daily data.
Each result includes the full context. Not just similarity, but confidence, volatility, outcomes, and consensus.
Each match shows top percentage. "top 0.003%" match beats 99.997% of all 10M+ windows searched. So you know if 0.93 is exceptional or ordinary.
"confidence": "top 0.003%"Across all matches: "7 of 10 bullish, 3 of 10 bearish." The single number a trader checks first before examining individual matches.
"direction": "bullish" · "consensus": "70%"Every match shows 7-day, 14-day, and 30-day returns with max gain and max drawdown. A pattern can be bullish at 7d but bearish at 30d.
"7d": +3.2% · "14d": +7.4% · "30d": -1.8%A 10% move means different things for different assets. Each match shows a volatility ratio. 1.0x is normal, 2.5x means crisis-level.
"volatility_ratio": 1.85 · "context": "elevated"Search only for patterns that formed during calm or high-volatility periods. Filter with min_volatility and max_volatility.
Default returns the top-N by similarity. Or filter to same_pair, same_asset_class, cross_asset, or balanced.
Search any instrument, see pattern matches with full charts, and explore outcomes right in your browser. No API key needed to try.
Send a symbol and a lookback window. Get back ranked pattern matches with similarity scores, confidence percentiles, outcomes, and consensus. All as clean JSON.
curl -X POST /v1/similar-patterns \
  -H "X-API-Key: cm_your_key" \
  -H "Content-Type: application/json" \
  -d '{
    "symbol":   "BTCUSDT",
    "lookback": 30,
    "top_n":    10
  }'
{
  "symbol": "BTCUSDT",
  "relevance": "same_pair",
  "similarity": 0.9487,
  "confidence": "top 0.003%",
  "volatility_ratio": 1.12,
  "period": "2024-03-12 → 2024-04-10",
  "outcome": {
    "return": "+15.21%",
    "max_gain": "+18.40%",
    "max_drawdown": "-3.12%",
    "direction": "bullish"
  },
  "outcome_summary": {
    "consensus": "7/10 bullish (70%)",
    "avg_return": "+8.73%"
  }
}
All plans include outcome data, confidence scores, and multi-timeframe breakdowns.
From manual lookups to fully automated pipelines.
Get a second opinion on any chart setup. See how similar patterns played out historically before placing a trade.
Integrate pattern insights directly into your strategy pipeline via the REST API.
Query multi-asset historical outcomes at scale. DTW finds shape-similar patterns even when time-compressed or stretched.
Embed pattern intelligence into your dashboard, Telegram bot, or TradingView script.
What traders ask before they sign up.
confidence percentile ("top 0.003%") so you know if 0.93 is exceptional for that query or just average./health endpoint shows the last sync timestamp.same_pair, same_asset_class, or cross_asset) so you always know the type of match you're looking at.5 free API calls per month. No credit card required. Upgrade when you need more.